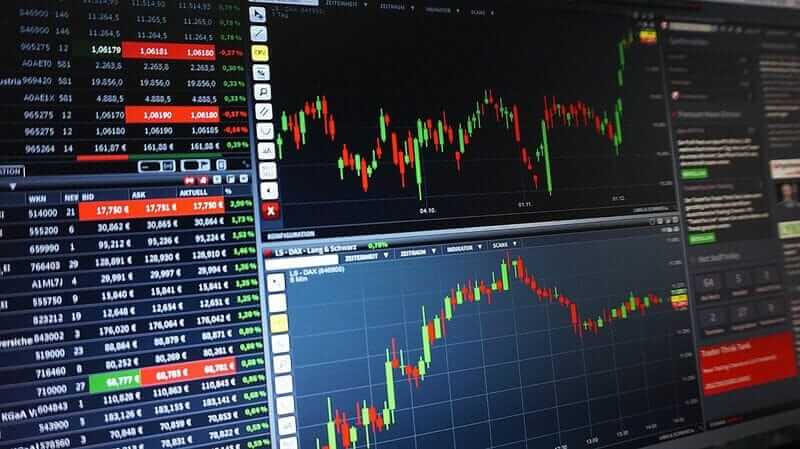
The Quote Overview page gives you a snapshot view for a specific Forex symbol. During market hours, delayed exchange price information displays (Forex: 10 minute delay, CT) and new delayed trade updates are updated on the page (as indicated by a "flash").
Barchart Symbol Notes Tutorial (8:43)
Quoteboard data fields include:
- Day High / Low: The highest and lowest trade price for the current trading session.
- Open: The opening price for the current trading session is plotted on the day's High/Low histogram.
- Previous Close: The closing price from the previous trading session.
- Bid: The last bid price and bid size.
- Ask: The last ask price and ask size.
- Weighted Alpha: A measure of how much a stock or commodity has risen or fallen over a one-year period. Barchart takes this Alpha and weights this, assigning more weight to recent activity, and less (0.5 factor) to activity at the beginning of the period. Thus, Weighted Alpha is a measure of one-year growth with an emphasis on the most recent price activity.
Chart Snapshot
A thumbnail of a daily chart is provided, with a link to open and customize a full-sized chart.
Price Performance
This section shows the Highs and Lows over the past 1, 3 and 12-Month periods. Click the "See More" link to see the full Performance Report page with expanded historical information.
Most Recent Stories
View the latest top stories from the Associated Press or Canadian Press (based on your Market selection).
Barchart Technical Opinion
The Barchart Technical Opinion widget shows you today's overally Barchart Opinion with general information on how to interpret the short and longer term signals. Unique to Barchart.com, Opinions analyzes a stock or commodity using 13 popular analytics in short-, medium- and long-term periods. Results are interpreted as buy, sell or hold signals, each with numeric ratings and summarized with an overall percentage buy or sell rating. After each calculation the program assigns a Buy, Sell, or Hold value with the study, depending on where the price lies in reference to the common interpretation of the study. For example, a price above its moving average is generally considered an upward trend or a buy.
A symbol will be given one of the following overall ratings:
- Strong Buy (greater than "66% Buy")
- Buy (greater than or equal to "33% Buy" and less than or equal to "66% Buy")
- Weak Buy ("0% Buy" through "33% Buy")
- Hold
- Strong Sell (greater than "66% Sell")
- Sell (greater than or equal to "33% Sell" and less than or equal to "66% Sell")
- Weak Sell ("0% Sell" through "33% Sell")
The current reading of the 14-Day Stochastic indicator is also factored into the interpretation. The following information will appear when the following conditions are met:
- If the 14-Day Stochastic %K is greater than 90 and the Overall Opinion is a Buy, the following displays: "The market is in highly overbought territory. Beware of a trend reversal."
- If the 14-Day Stochastic %K is greater than 80 and the Overall Opinion is a Buy, the following displays: "The market is approaching overbought territory. Be watchful of a trend reversal."
- If the 14-Day Stochastic %K is less than 10 and the Overall Opinion is a Sell, the following displays: "The market is in highly oversold territory. Beware of a trend reversal."
- If the 14-Day Stochastic %K is less than 20 and the Overall Opinion is a Sell, the following displays: "The market is approaching oversold territory. Be watchful of a trend reversal."
Related Stocks
For comparison purposes, find information on other symbols contained in the same sector.
Barchart Commodities Insider Commentary
Barchart Commodities Insider is Ag market commentary for Grains and Oilseeds, Energy, Gold, Silver, Cocoa, Coffee, and Sugar markets.
Commitment of Traders Positions
This widget shows the latest week's Commitment of Traders open interest. The COT data, as reported by the US Commodity Futures Trading Commission (CFTC), is from Tuesday, and is released Friday by the CFTC. Reporting firms send Tuesday open interest data on Wednesday morning. The CFTC then corrects and verifies the data for release by Friday afternoon. The Barchart site's data is then updated, after the official CFTC release.
You will see the Long and Short positions from the Legacy Commitments of Traders report, plus either the Long and Short positions from the Disaggregated Report or the Financial TFF Report.
A link to view a chart with both COT studies applied is also available.


/Phone%20and%20computer%20internet%20network.jpg)


.jpg)
